Dashboard
The dashboard combines the key indicators you need at a glance.
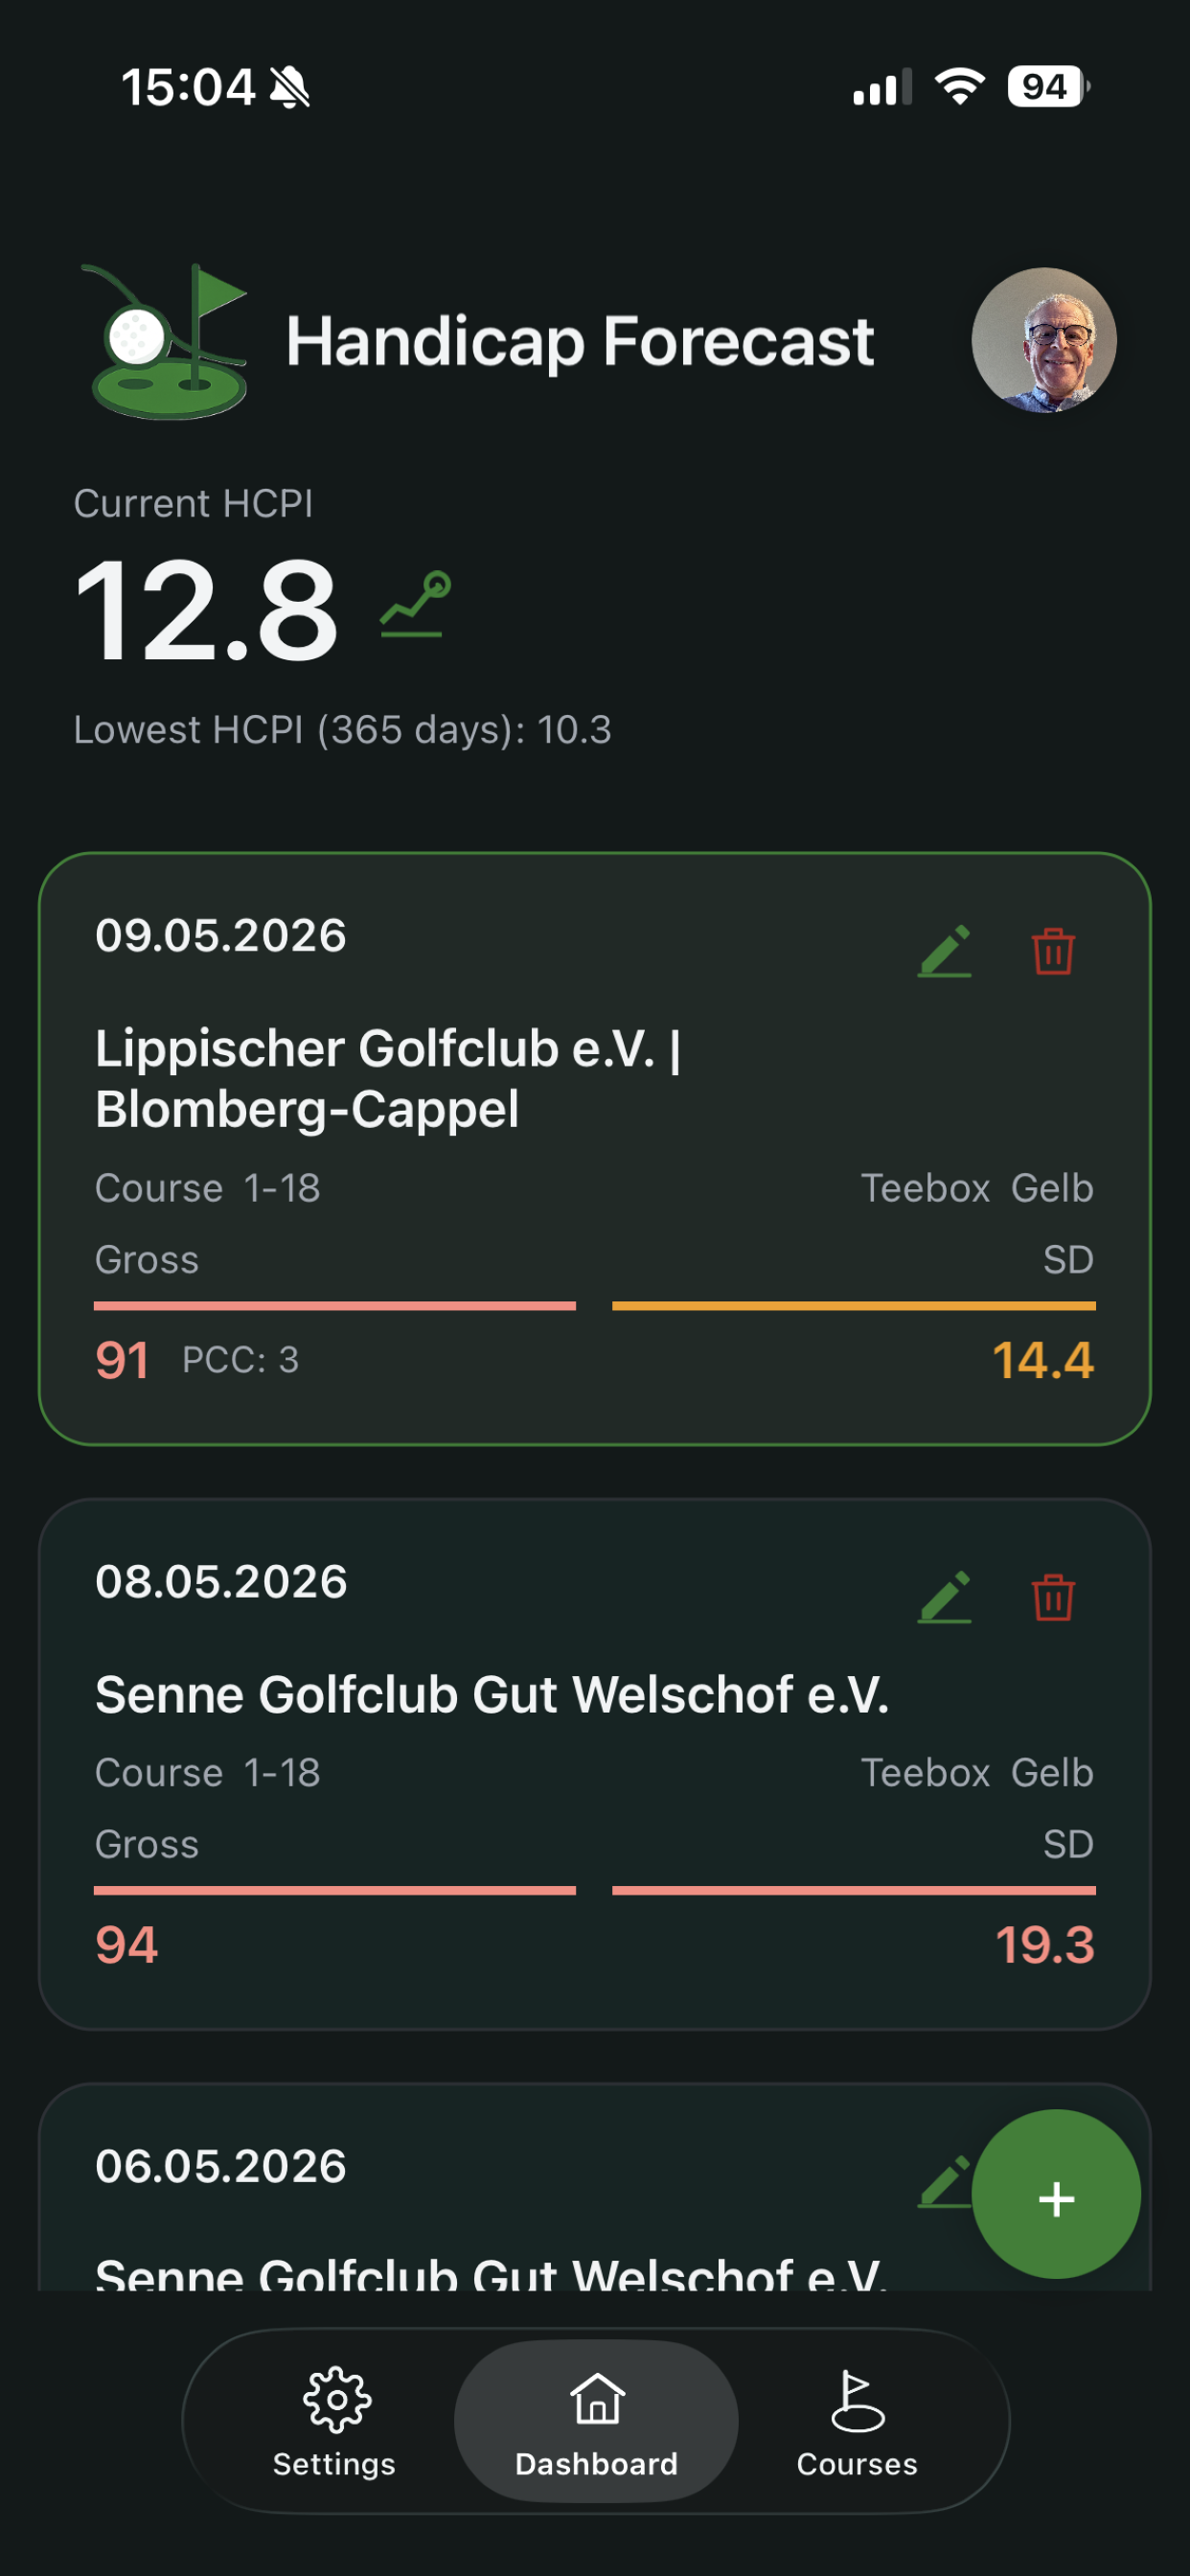
Top-level indicators
Depending on your data, the top area shows:
- current HCPI
- calculated HCPI (can differ when Soft Cap or Hard Cap applies)
- lowest HCPI of the last 365 days
HCPI Scenarios (Premium)
HCPI Scenarios are one of the core Premium features of the app. Open them from the dashboard via the HCPI scenarios icon. This sheet does more than show status: it gives you an immediate forecast of how your next result will affect your HCPI.
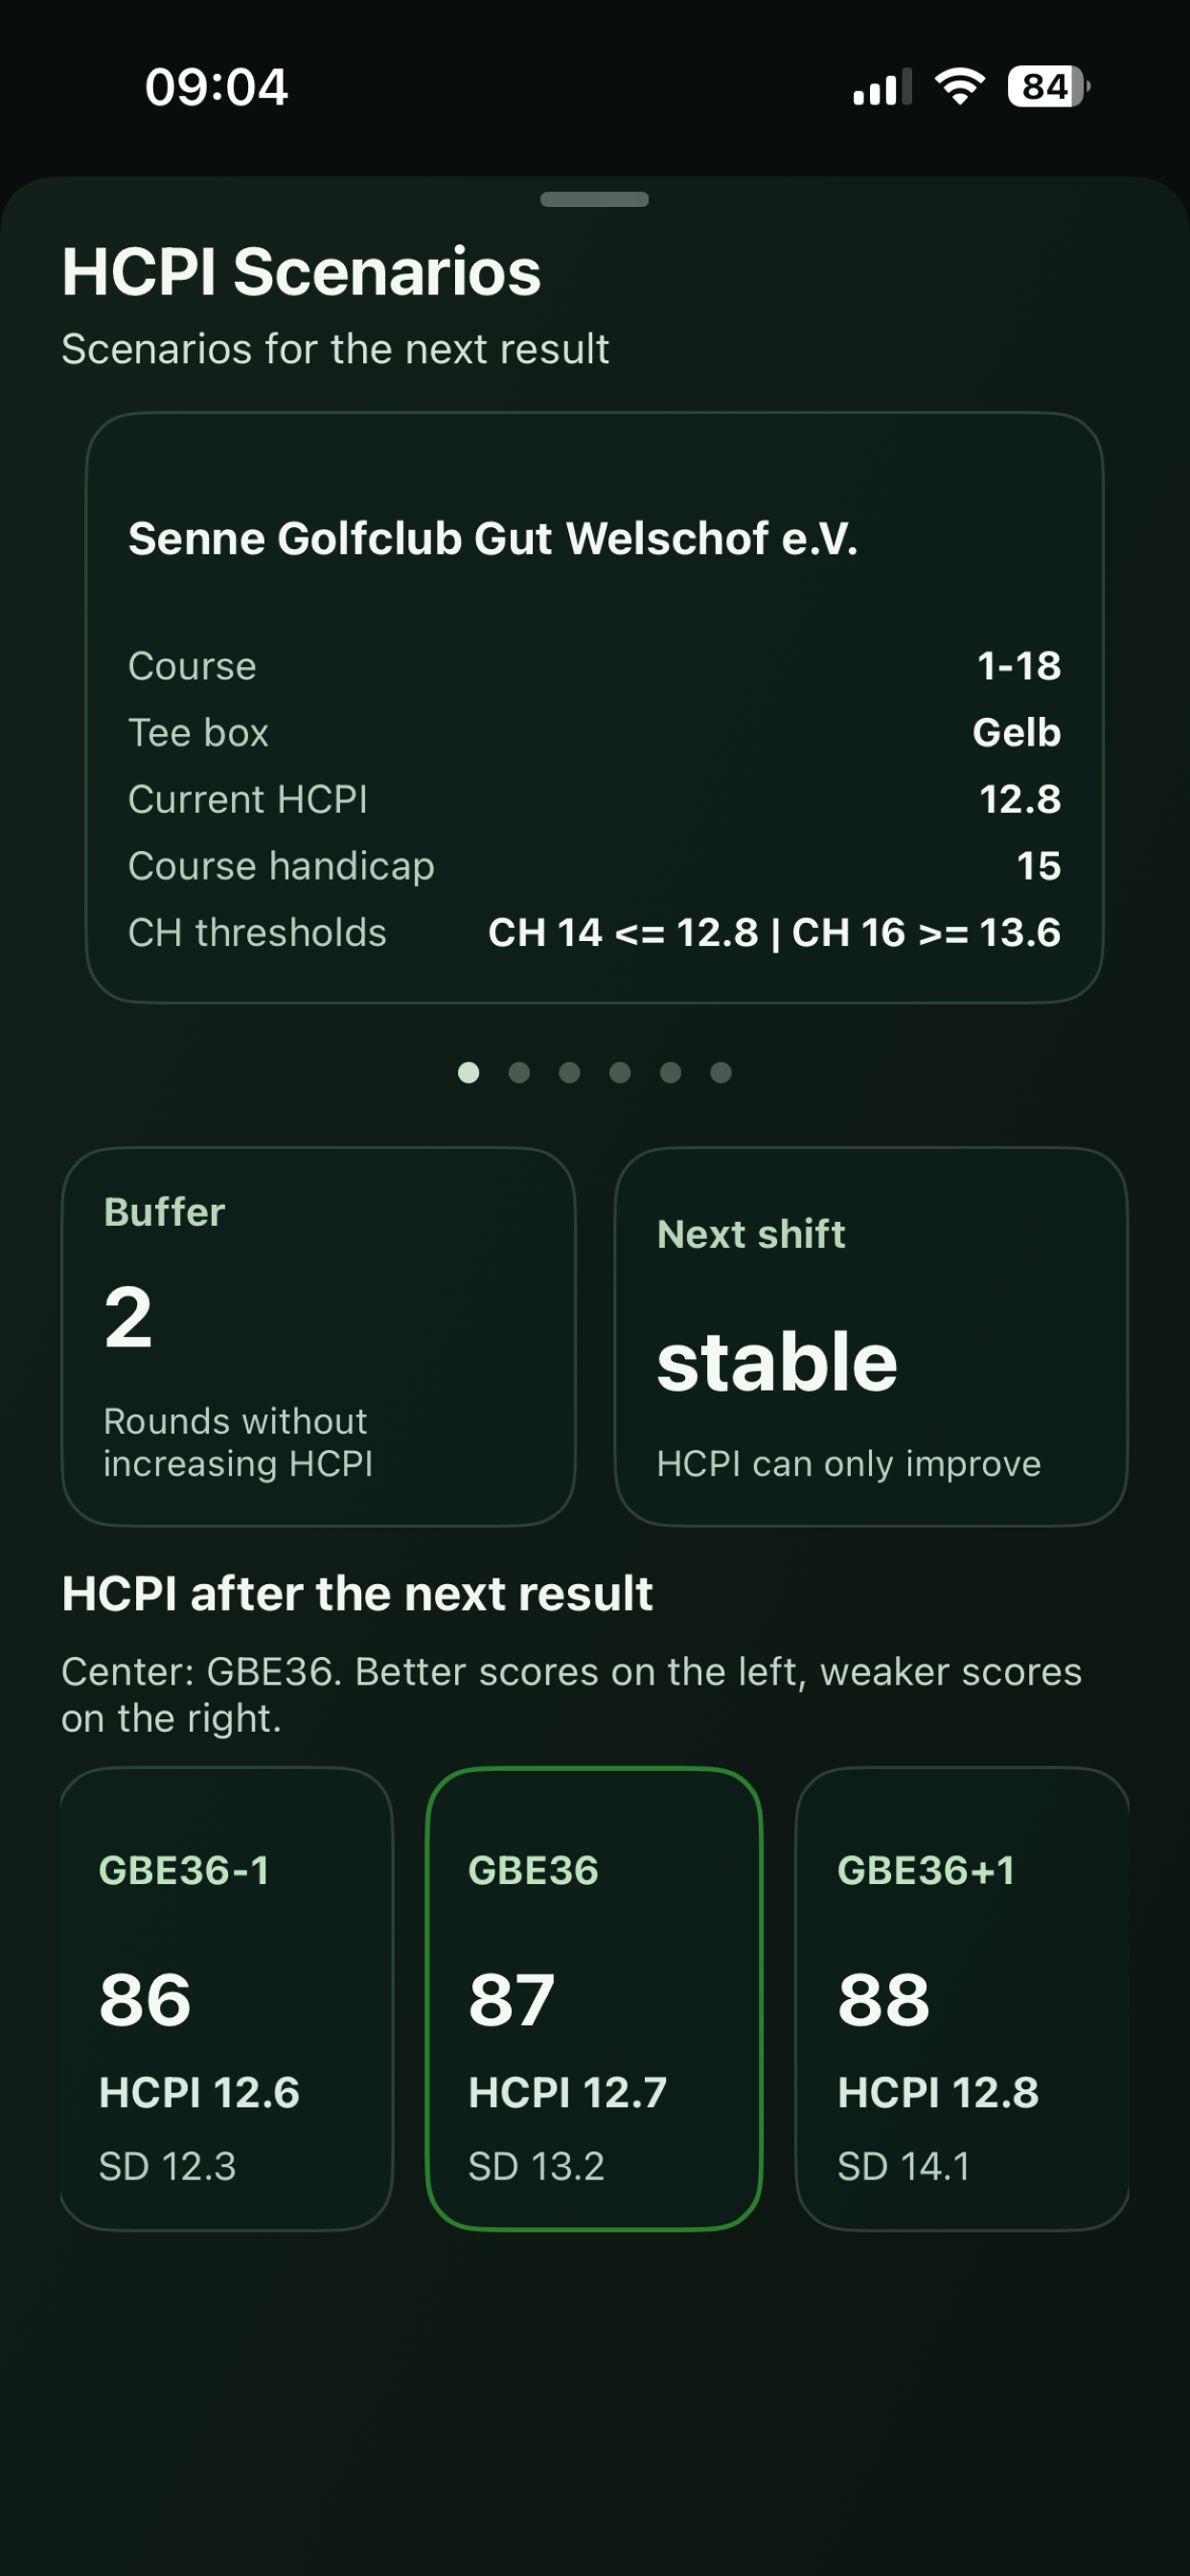
The top navigation card shows the currently selected tee box context:
- course and tee box
- current HCPI
- current course handicap
- CH thresholds (the HCPI levels where course handicap changes up or down for that tee box)
If multiple tee boxes are marked as favorites, you can swipe in the top card to switch between them. The full scenario updates instantly for the selected tee box.
The middle cards summarize your short-term risk:
- Buffer: number of rounds you can still play without increasing HCPI.
- Next shift: current status level (for example “stable” or “critical”).
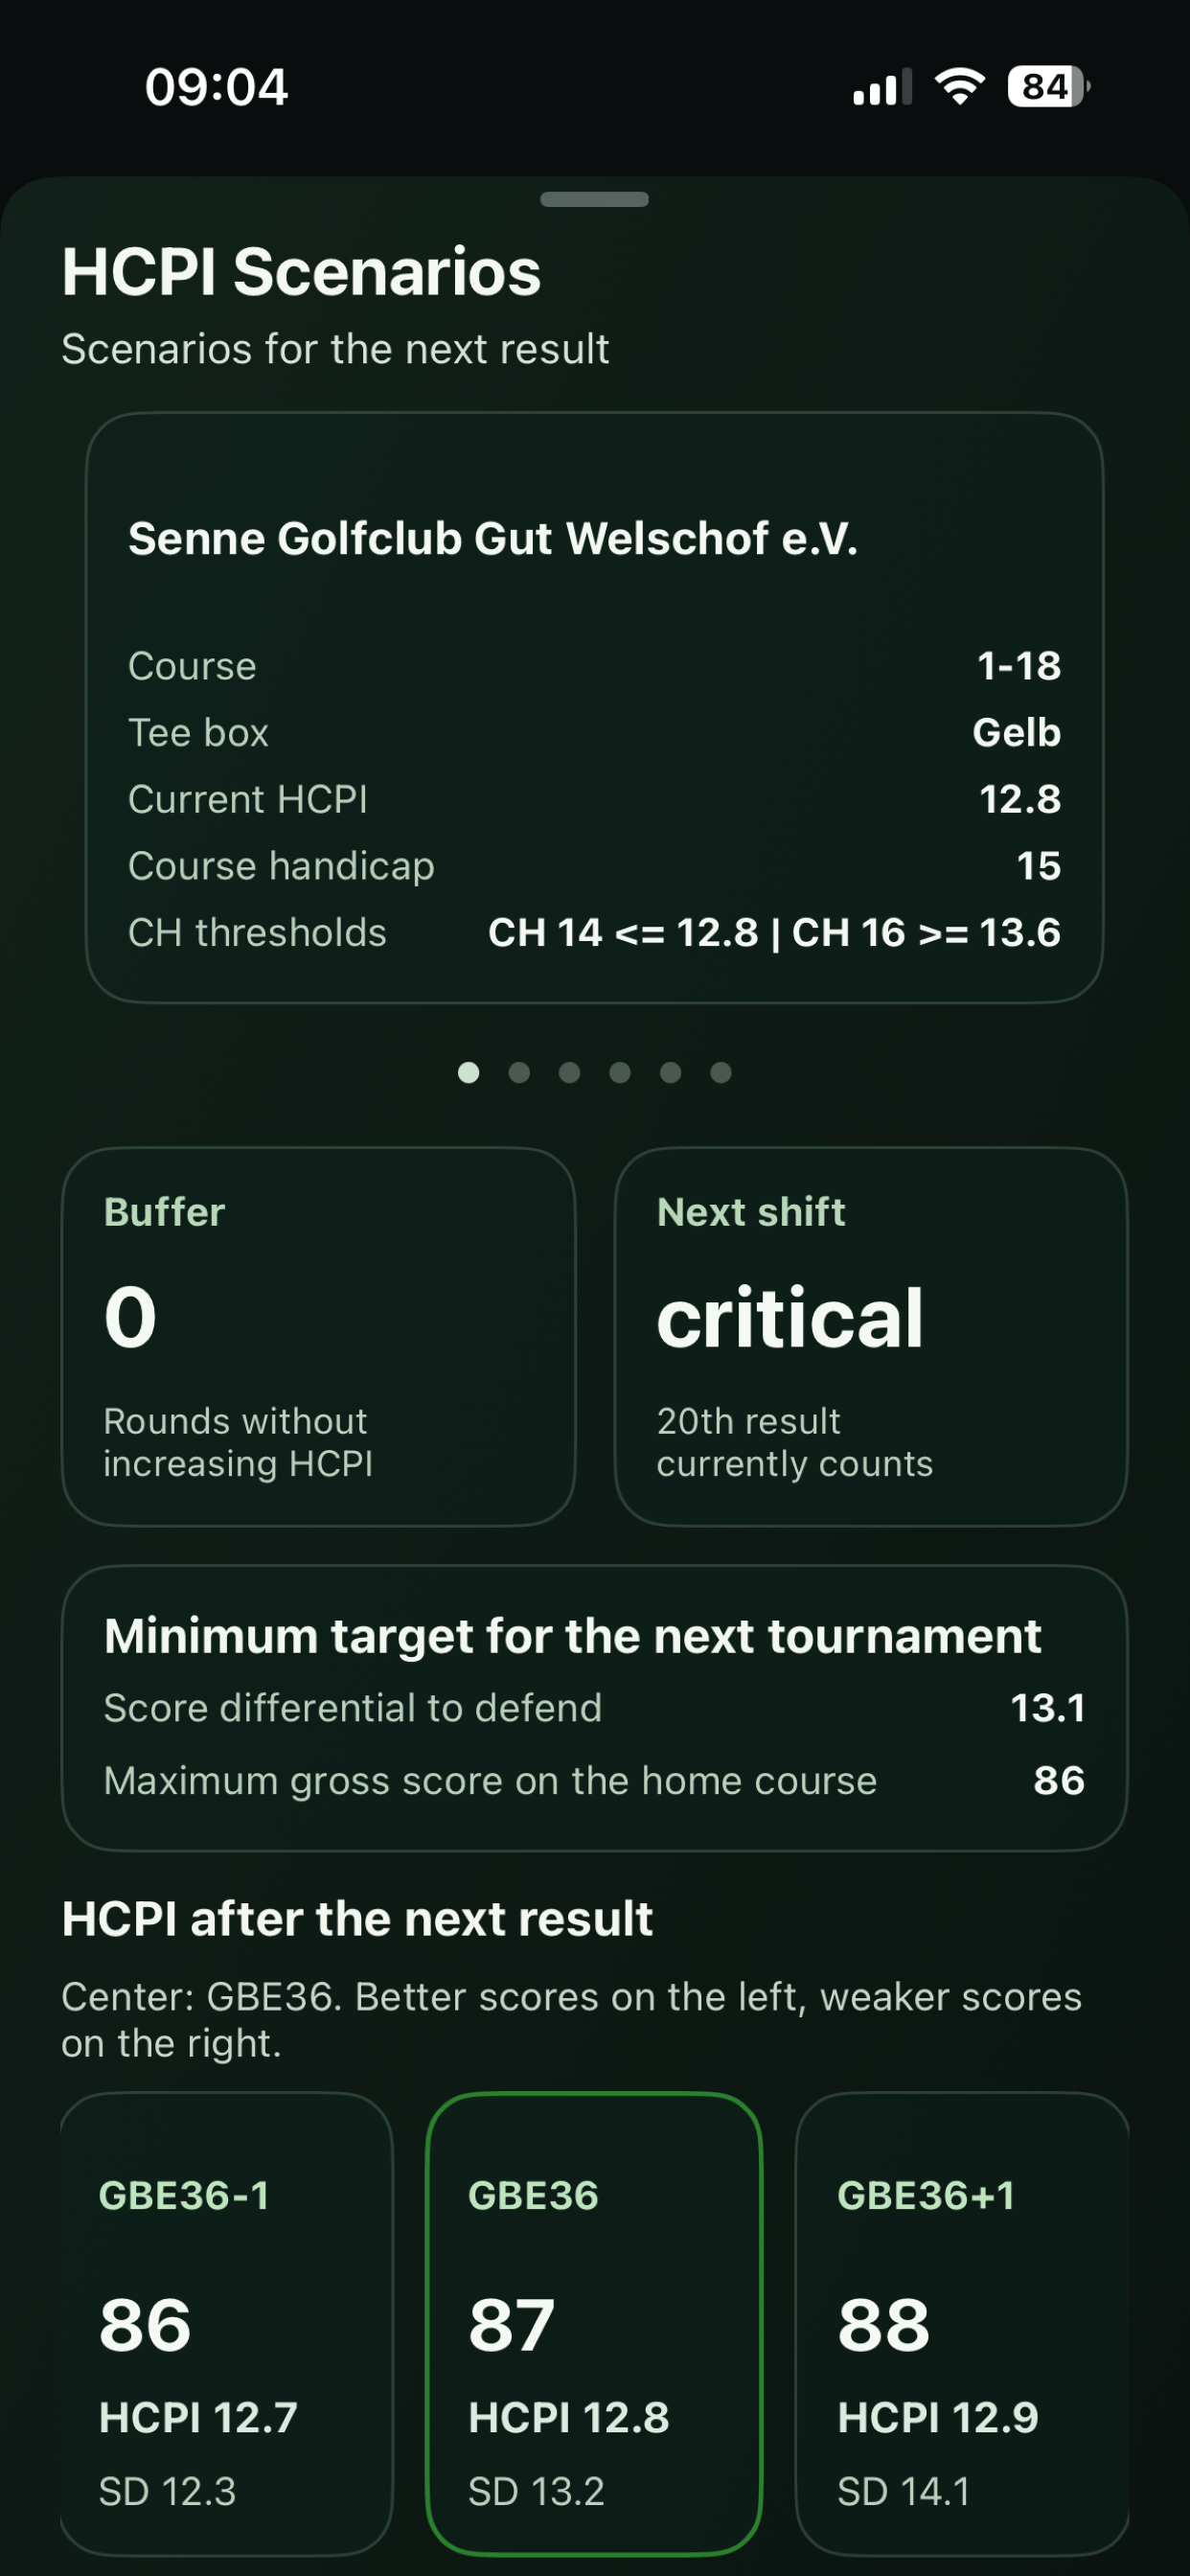
In the critical case, your next result drops the current 20th result from the list, and that 20th result is still part of the active best-8 valuation. That means the next round must meet a specific quality level to keep or improve HCPI. If you play a higher Score Differential than shown, HCPI will worsen.
The Minimum target for the next tournament card therefore highlights the key limits:
- score differential to defend
- maximum gross score on the selected course to keep the current HCPI
In the final section, HCPI after the next result, cards show projected HCPI and SD based on the GBE you play:
- GBE36 in the center is the score needed for 36 net points (playing to handicap).
- swiping left shows better outcomes and resulting HCPI.
- swiping right shows weaker outcomes and their HCPI impact.
This gives you a practical, decision-ready view before every round: where your safe zone is, where risk begins, and what score you should target.
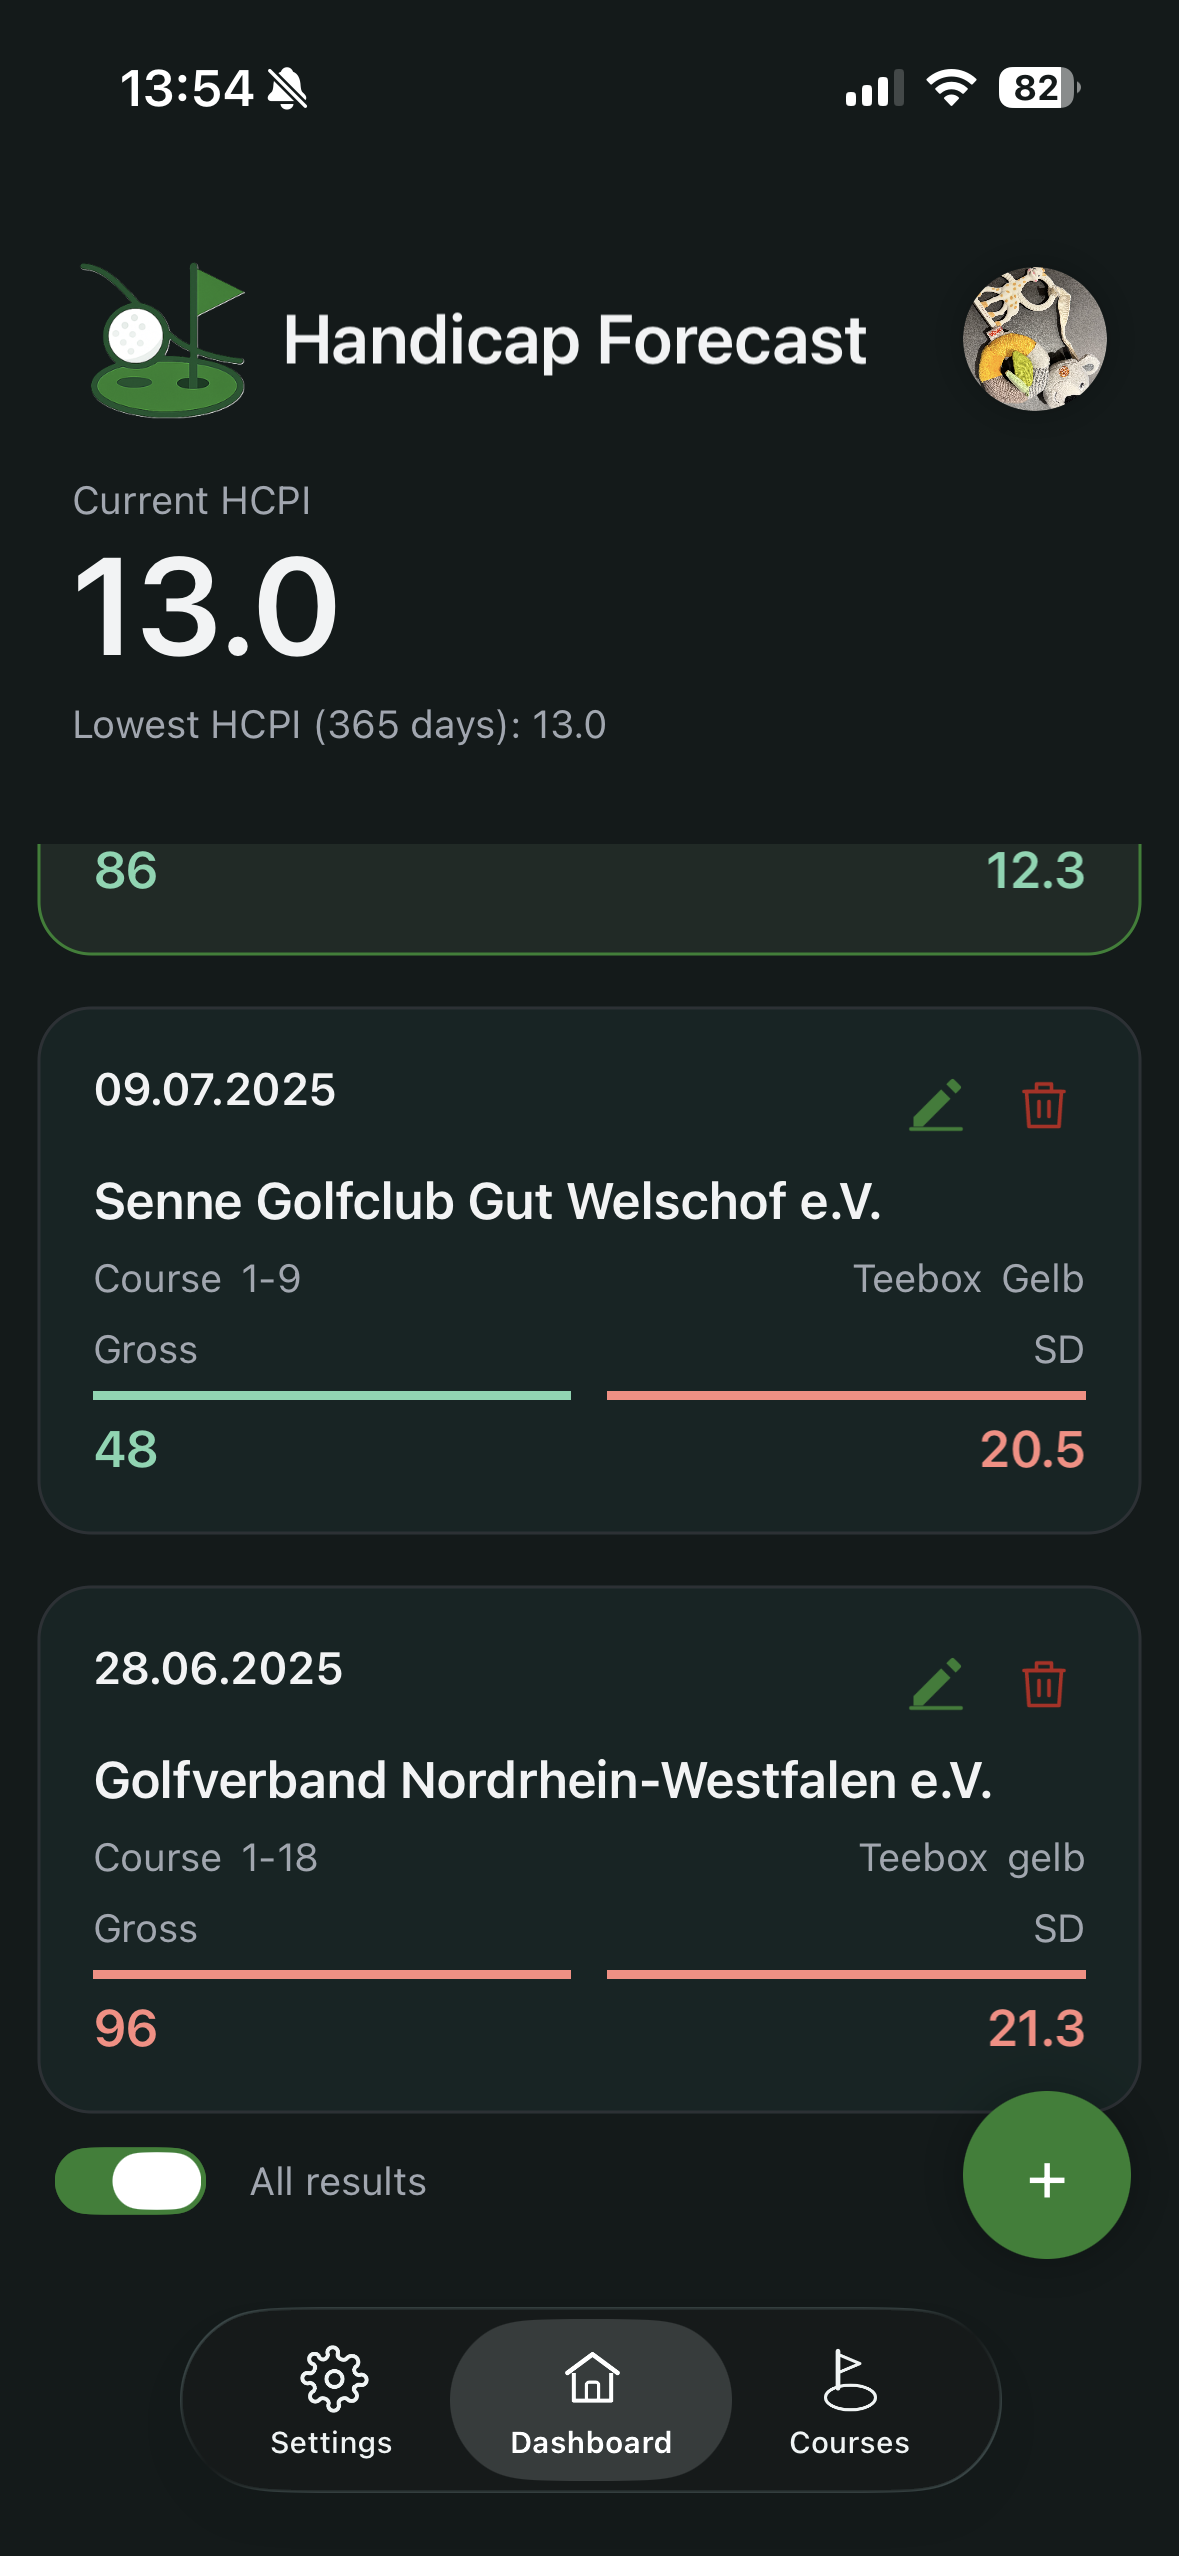
Reading result cards
Each card includes core round data, including:
- date
- club, course and tee box
- GBE
- Score Differential
Color markers support quick interpretation:
- green border: round contributes to the active low-score set
- green: value is at or below reference
- orange: above reference, up to +3
- red: more than +3 above reference
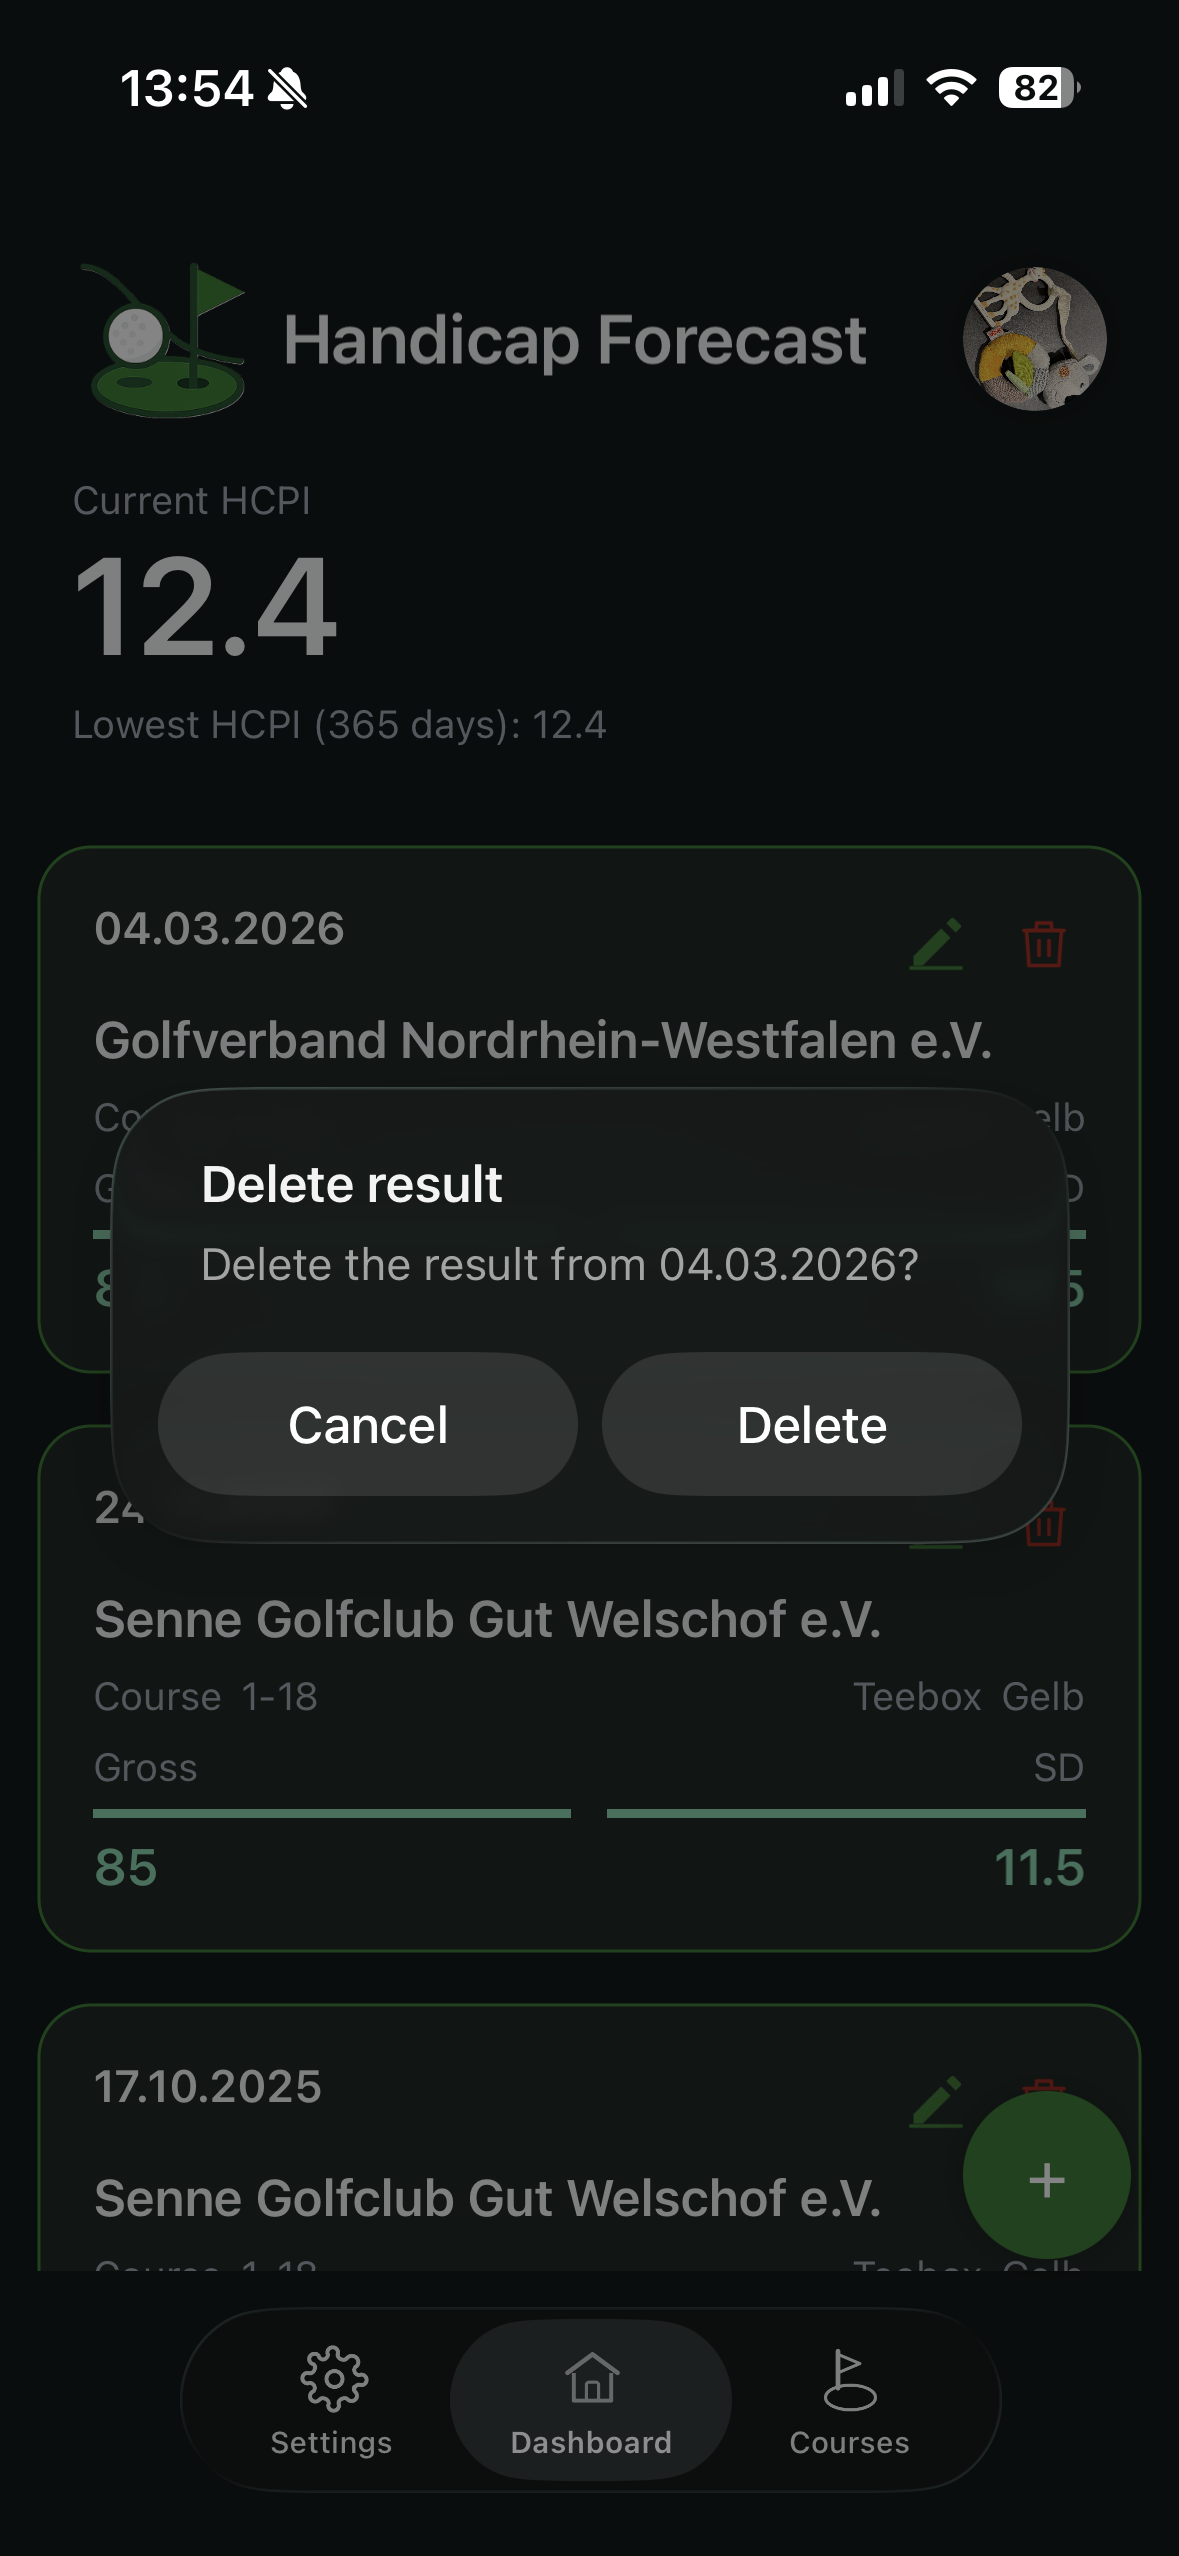
Edit and delete
- Use the pencil icon to edit a result.
- Use the bin icon to delete a result.
- A safety confirmation appears before delete.
“All results” toggle
The toggle under the list controls scope:
- off: focus on recent entries
- on: full result history
In Free mode, up to 20 results are shown.