Dashboard
The dashboard combines the key indicators you need at a glance.
Top-level indicators
Depending on your data, the top area shows:
- current HCPI
- calculated HCPI (can differ when Soft Cap or Hard Cap applies)
- lowest HCPI of the last 365 days
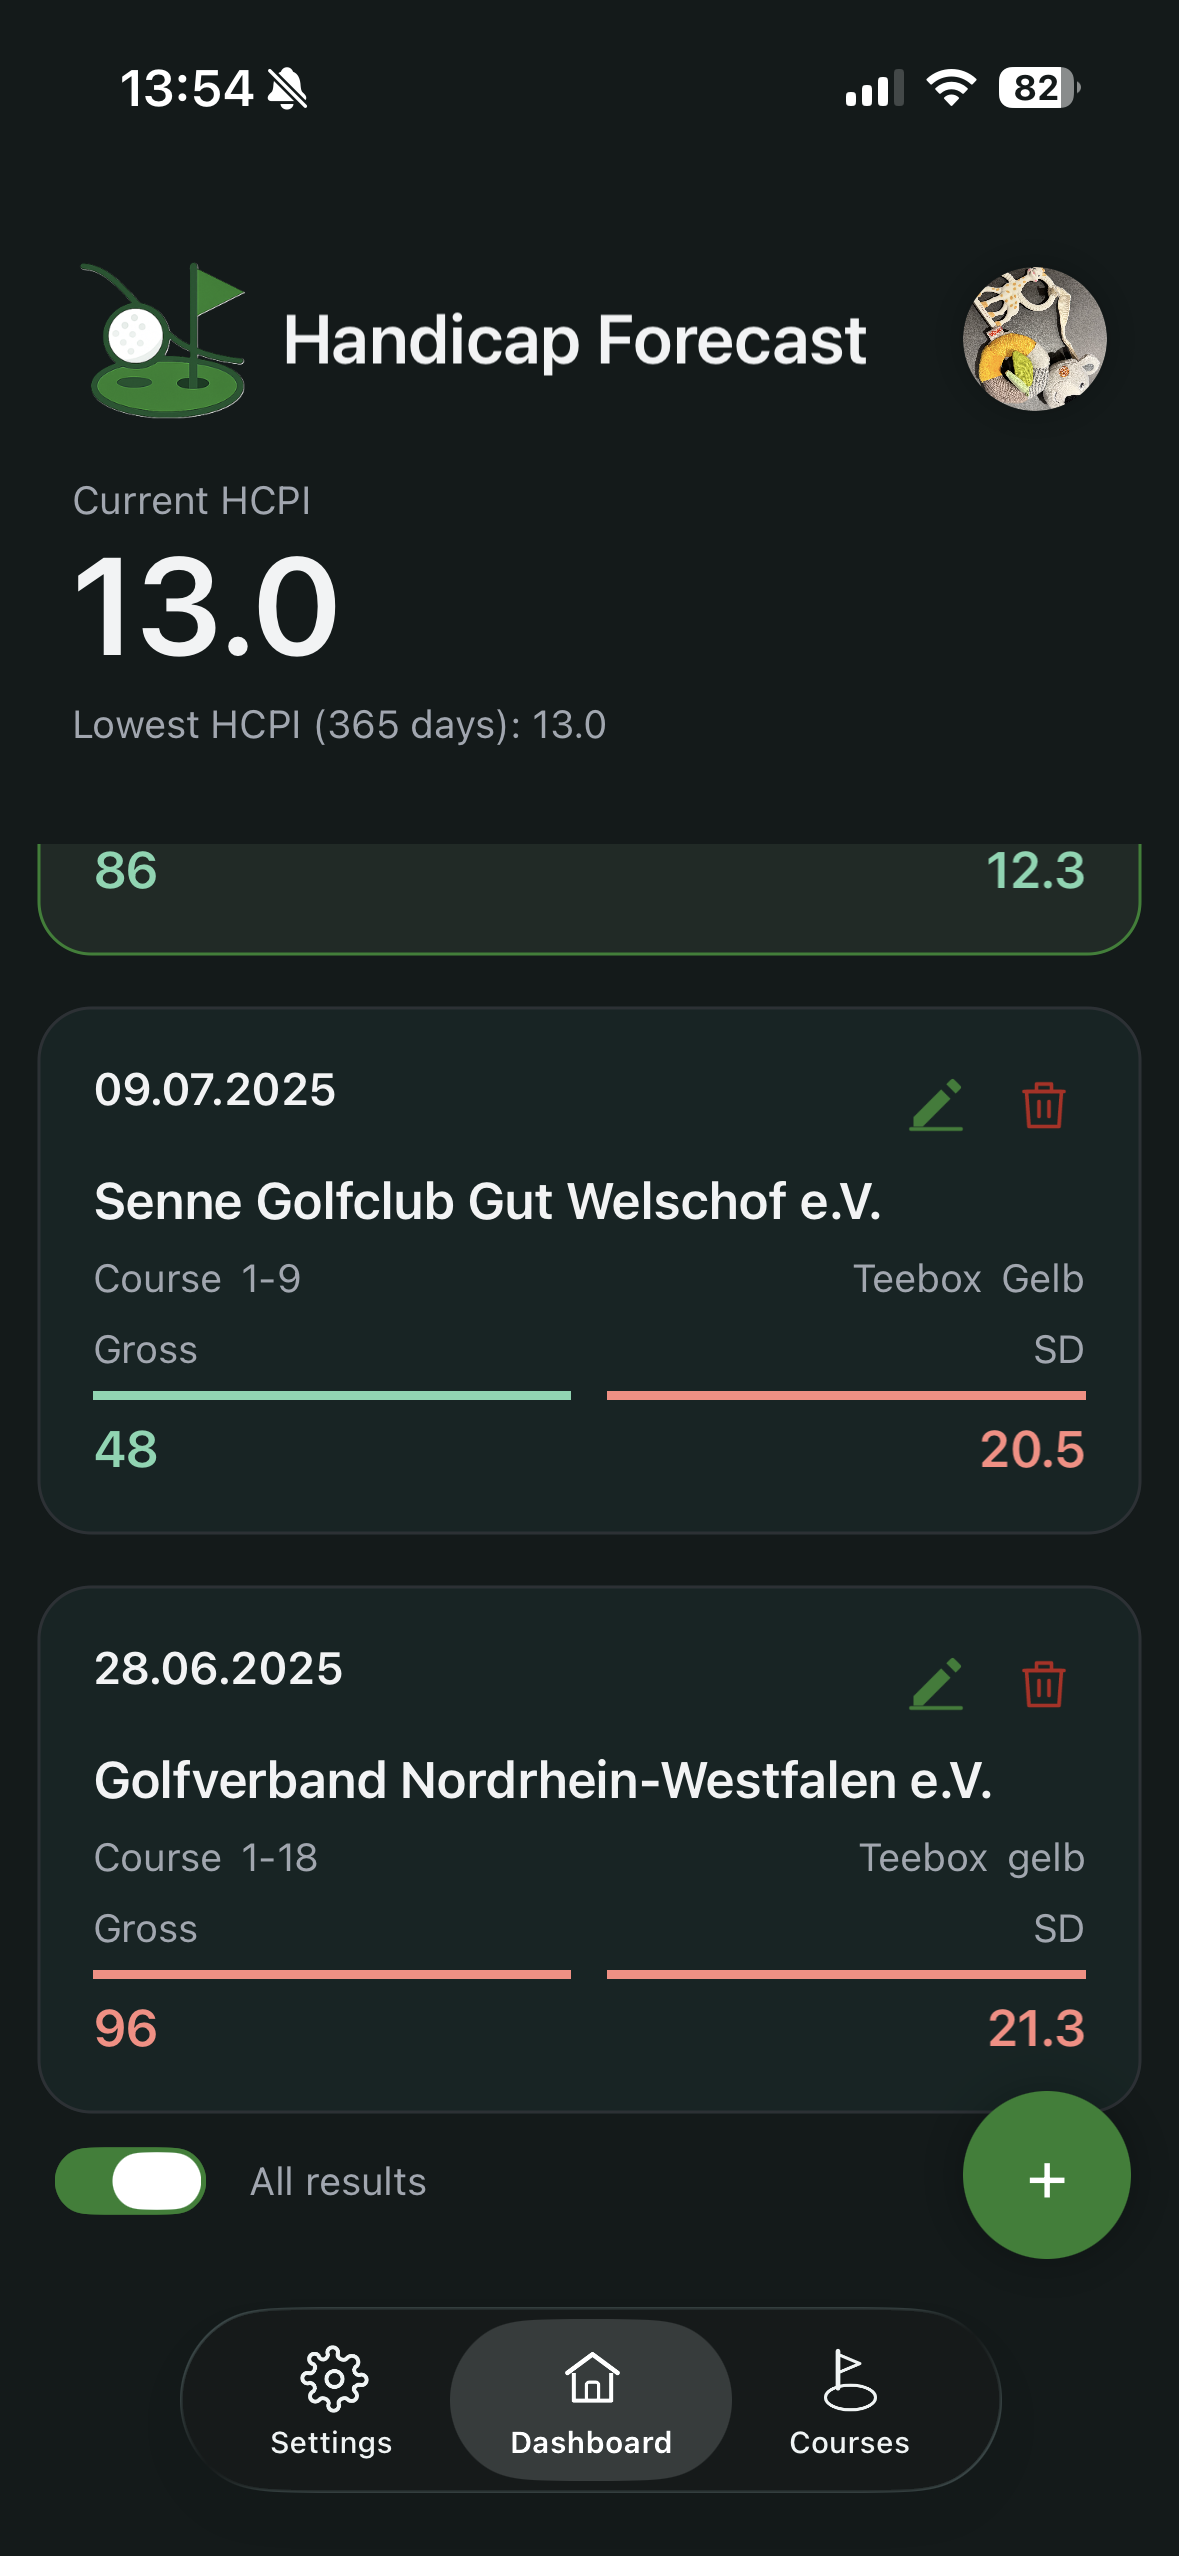
Reading result cards
Each card includes core round data, including:
- date
- club, course and tee box
- GBE
- Score Differential
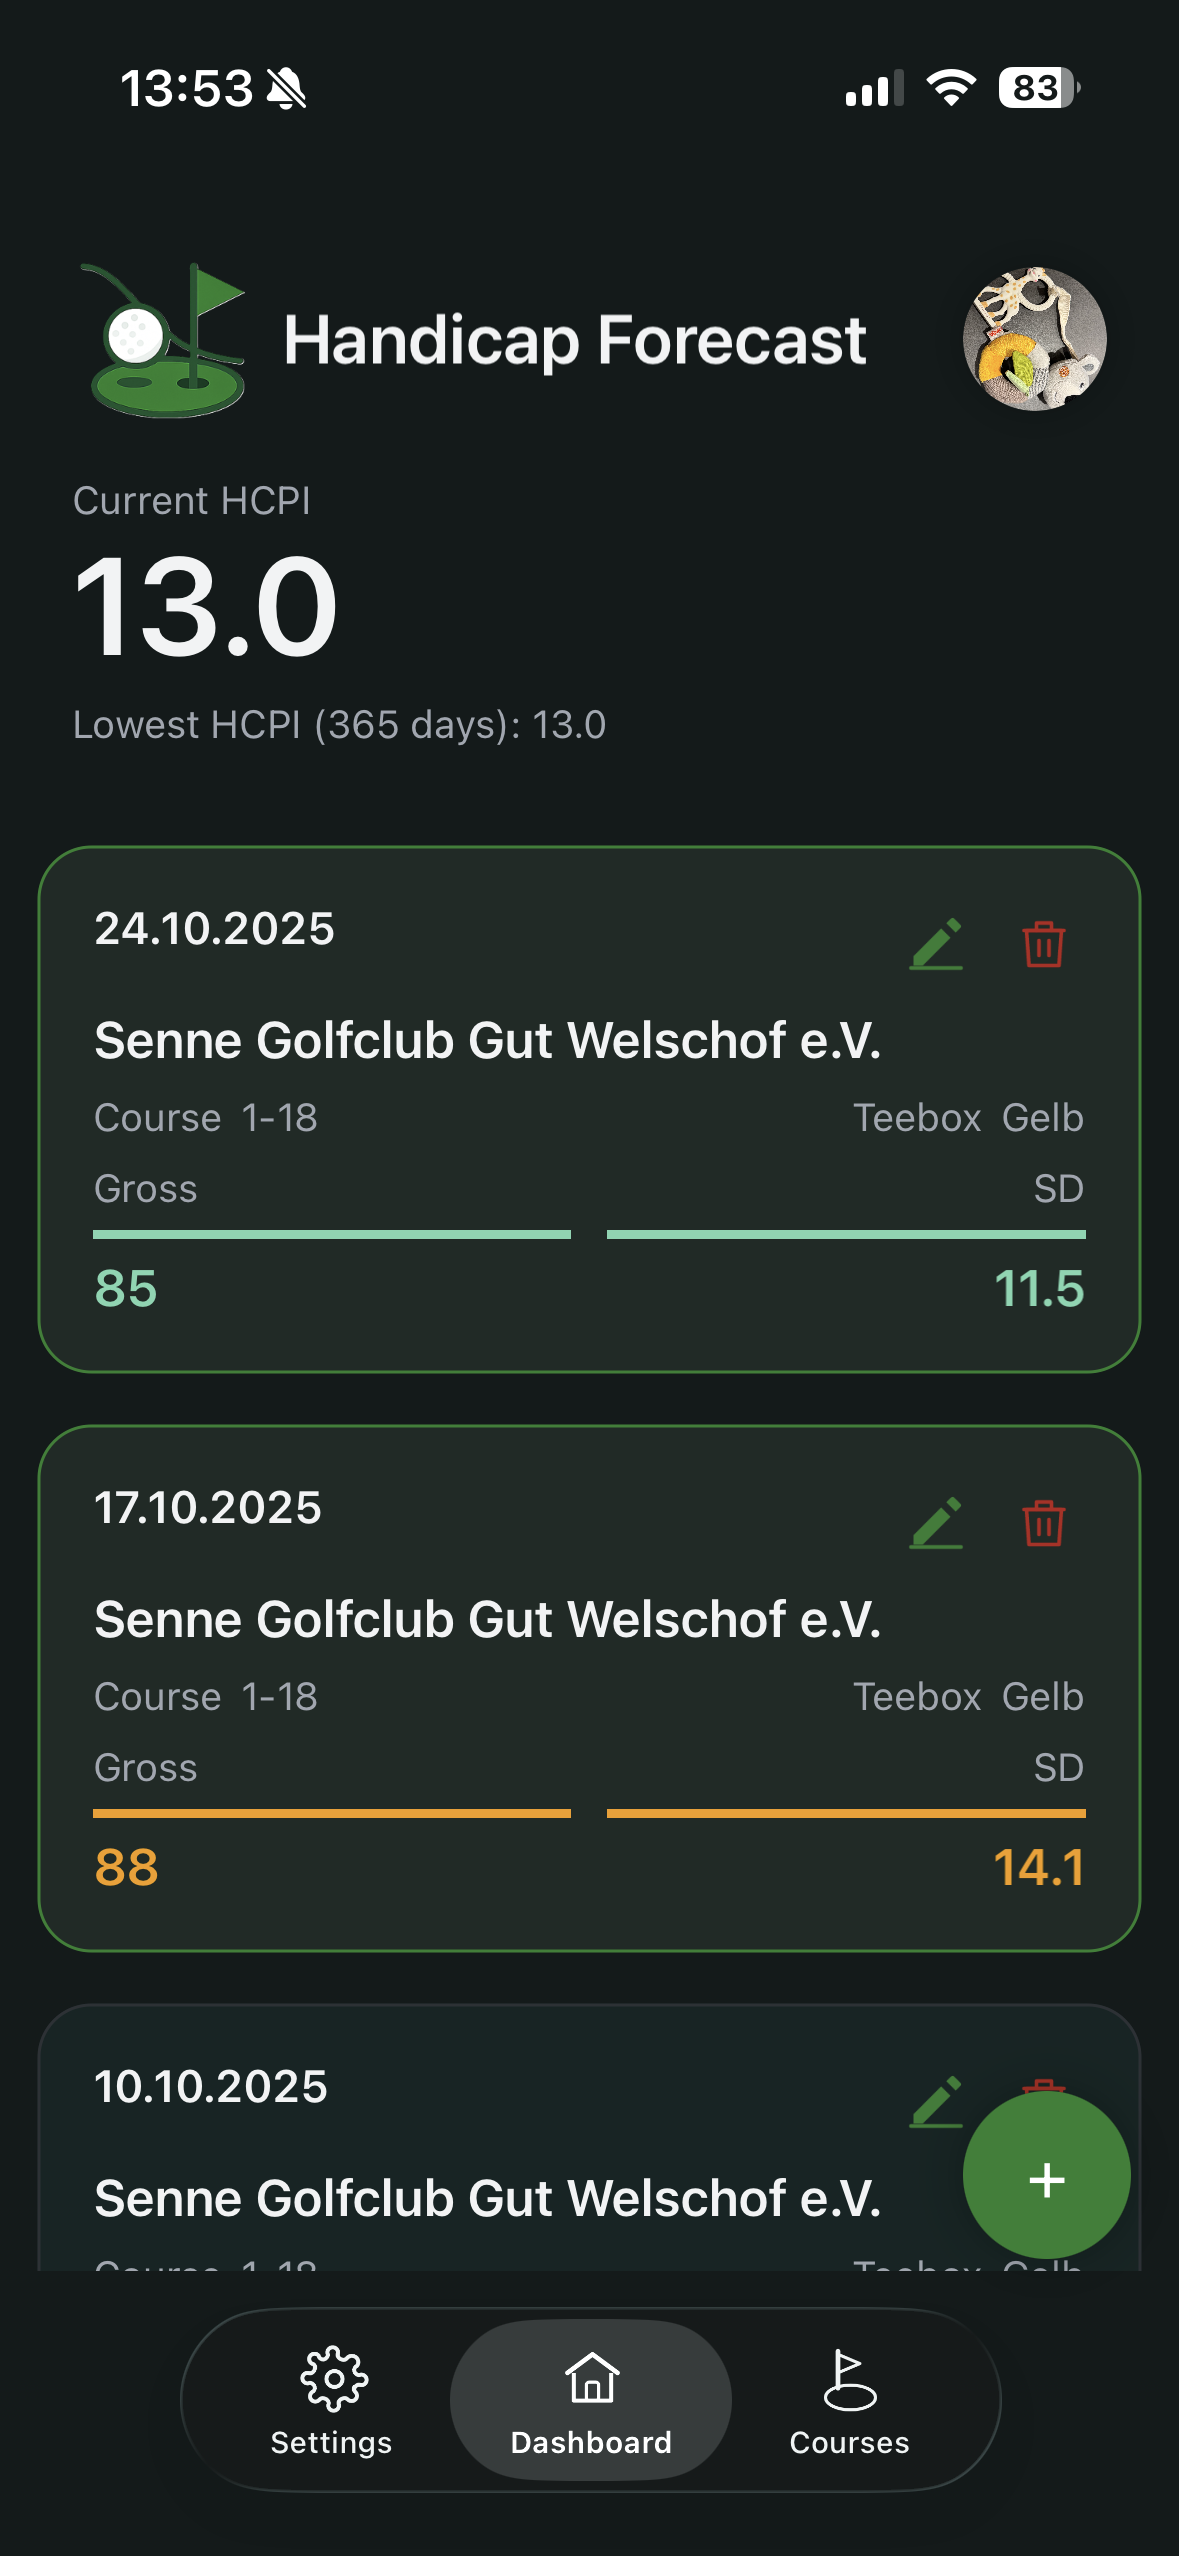
Color markers support quick interpretation:
- green border: round contributes to the active low-score set
- green: value is at or below reference
- orange: above reference, up to +3
- red: more than +3 above reference
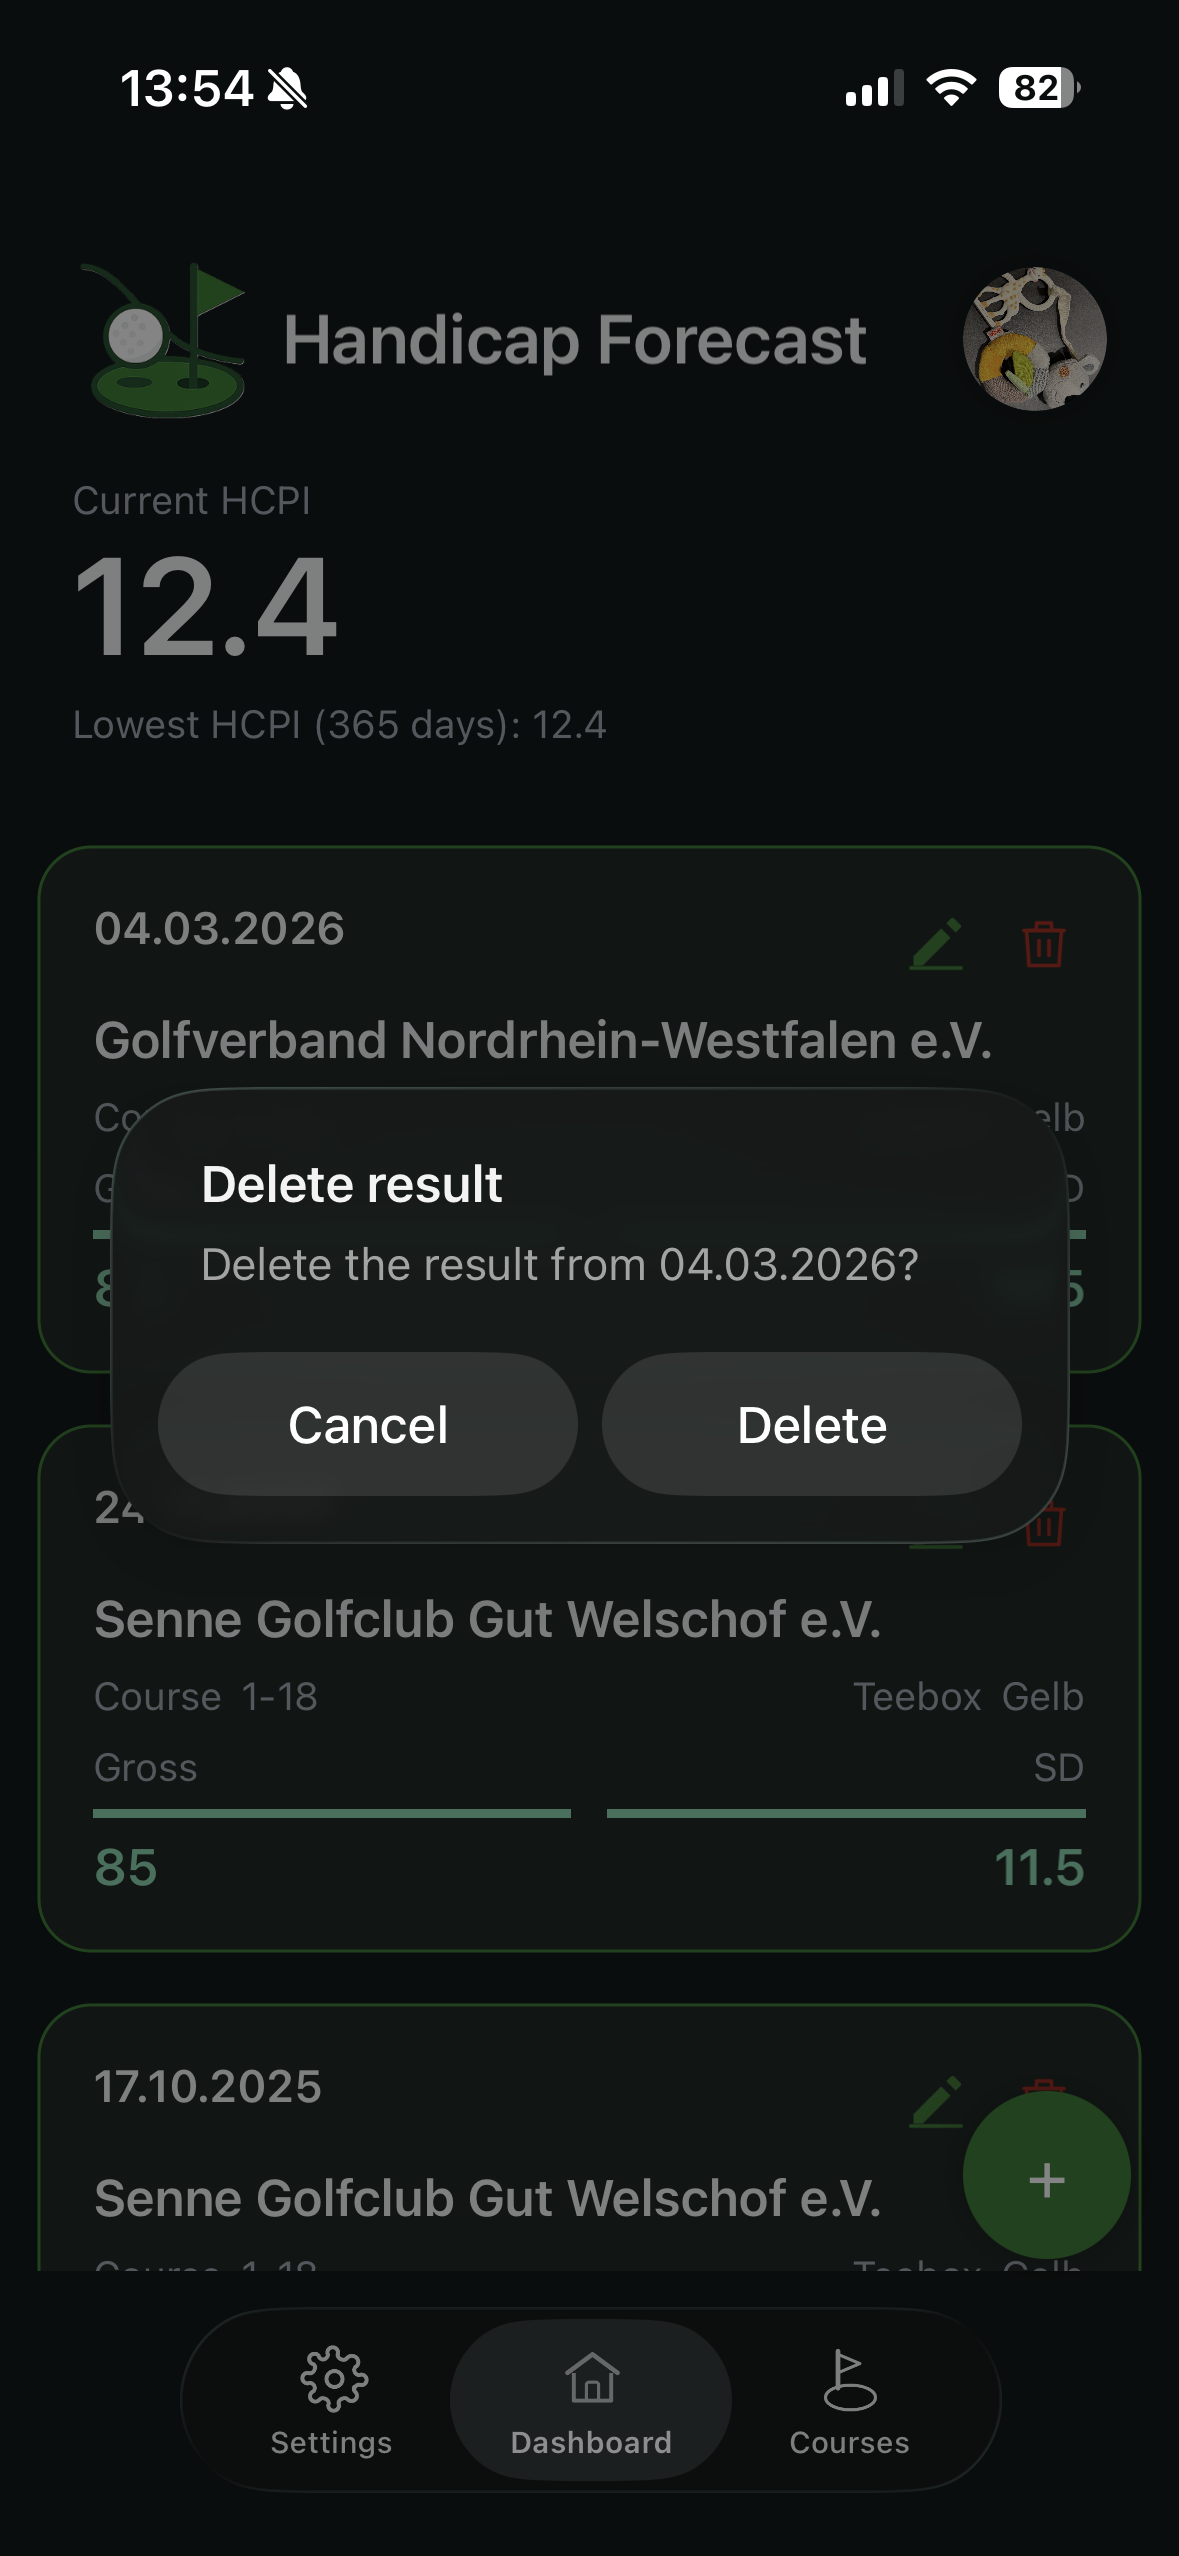
Edit and delete
- Use the pencil icon to edit a result.
- Use the bin icon to delete a result.
- A safety confirmation appears before delete.
“All results” toggle
The toggle under the list controls scope:
- off: focus on recent entries
- on: full result history
In Free mode, up to 20 results are shown.